Hi students, Welcome to AMBiPi (Amans Maths Blogs). In this article, you will get Statistics Mean Median Mode CBSE NCERT Notes Class 10 Maths Chapter 14 PDF. You can download this PDF and save it in your mobile device or laptop etc.
Statistics CBSE NCERT Notes Class 10 Maths Chapter 14 PDF
Arithmetic Mean (AM)
Arithmetic Mean of Unclassified Data
If n numbers be x1, x2, x3, …, xn, then the arithmetic mean of these unclassified data is

Arithmetic Mean of Frequency Distribution
If f1, f2, f3, …, fn, be the frequency of n numbers x1, x2, x3, …, xn, then the arithmetic mean of these frequency distribution is
Arithmetic Mean of Class Interval Data
To find the mean of a classified data, we first find class marks x1, x2, x3, …, xn, of the class intervals as the variables and take the frequencies of the classes f1, f2, f3, …, fn, as the corresponding frequencies of the variables. Then, the arithmetic mean of these classified data is
Deviation of a Term
The deviation of a term from the arithmetic mean is the quantity by which that term exceeds the arithmetic mean. If the variable be x and AM be A, then AM (x – A) is the deviation of x from A. Thus, the deviation is d = x – A.
Assumed Mean Method of AM for Simple Distribution
The arithmetic mean of n simple distribution when the assumed mean (a) and deviation d = x – A is given is
Assumed Mean Method of AM for Frequency Distribution
The arithmetic mean of frequency distribution when the assumed mean (a) and deviation d = x – A is given is
Step Deviation Method for AM
The step deviation method for arithmetic mean is where ‘a’ is assumed mean and u = (xi – A)/h
Class 10 Maths Chapter 14 Examples 1:
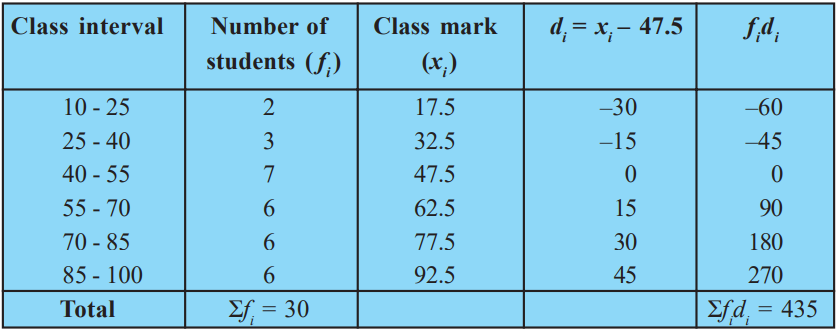
Find the mean by assumed mean method.
First, make a frequency distribution table as below with assumed mean and deviations.
Using assumed mean method, we get
Median
Median of Unclassified Data
First, we arrange the terms in ascending or descending order and then find the number of terms.
If ‘n’ is odd, then the median is
If ‘n’ is even, then the median is
Median of Classified Data
If in a continuous distribution the total frequency be N then the class whose commutative frequency is either equal to N/2 of just greater than N/2 is called the median class
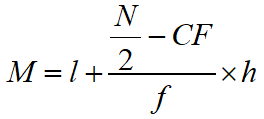
The median of continuous distribution is
where
l = Lower limit of median class
f = Frequency of median class
N = Total Frequency
CF = Cumulative Frequency of class just before median class
h = Class size of median class
Class 10 Maths Chapter 14 Examples 2:
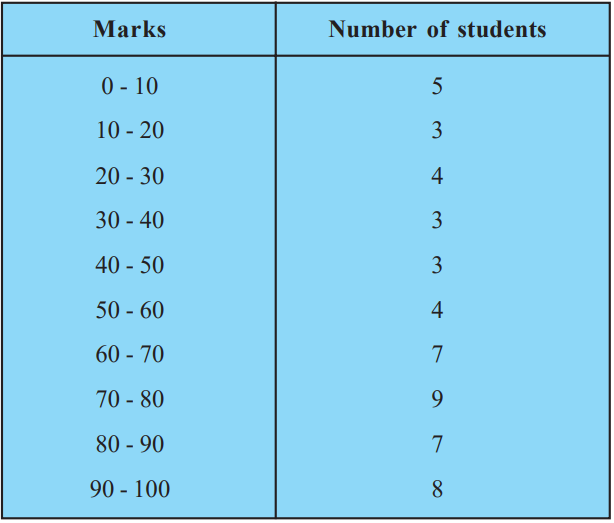
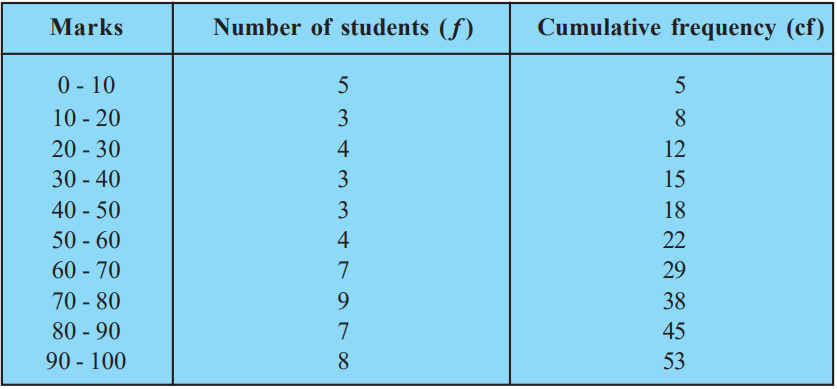
Find the median.
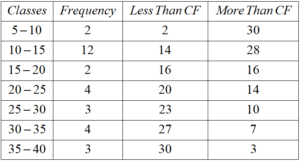
First, cumulative frequency is made as in table below.
Using Median formula, we get
Mode
Mode of Unclassified Data
In unclassified distribution, the mode is the data with highest frequency.
Mode of Classified Data
In unclassified distribution, the mode is the data with highest frequency.
The class with highest frequency is the mode class.
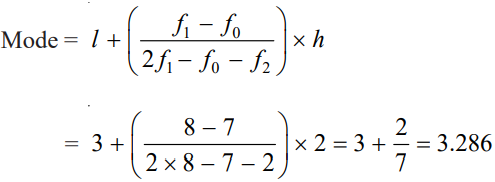
The mode of continuous distribution is
where
l = Lower limit of mode class
f = Frequency of mode class
f-1 = Frequency of pre-mode class
f-1 = Frequency of post-mode class
h = Class size of mode class
Class 10 Maths Chapter 14 Examples 3:
Find the mode.
Using the formula, we get
Empirical Relations
Relation Among Mean, Median & Mode
The relation between mean, median and mode is Mode = 3Median – 2Mean.
Ogive Curve
Graphical Representation of Cumulative Frequency.
Ogive curve is a graph that is used to find the median graphically.
To represent the graph of cumulative frequency curve, you need find LESS THAN and MORE THAN cumulative points and then plot it on coordinate axes.
For better understand, start with an example.
Class 10 Maths Chapter 14 Examples 4:
Draw an ogive curve and then find the median.
First, you need to find cumulative frequency of the above data.
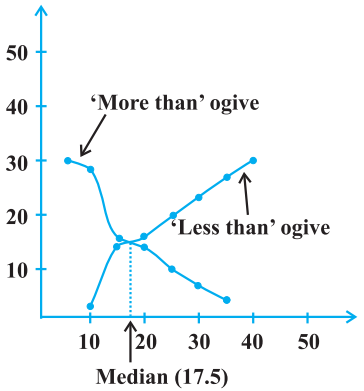
For LESS THAN Ogive Curve, you need to select Upper Limit of each class as x-coordinate and LESS THAN cumulative frequency of corresponding class as y-coordinate.
It means, plot (10, 2), (15, 14), (20, 16), (25, 20), (30, 23), (35, 27), (40, 30) for LESS THAN Ogive curve.
For MORE THAN Ogive Curve, you need to select Lower Limit of each class as x-coordinate and MORE THAN cumulative frequency of corresponding class as y-coordinate.
It means, plot (5, 30), (10, 28), (15, 16), (20, 14), (25, 10), (30, 7) and (35, 3). for MORE THAN Ogive curve.
The intersection point of LESS THAN and MORE THAN Ogive curve gives the value of median on x-axis. Thus, the median of the given data is 17.5.
Click below to get CBSE Class 10 Maths Chapter wise Revision Notes PDF.


