Welcome to AMBiPi (Amans Maths Blogs). In this article, you will get 51 SAT Functions Graphs Practice Questions with Answer Keys | SAT 2023-24 Online Courses AMBiPi. SAT (Scholastic Assessment Test) is a standard test, used for taking admission to undergraduate programs of universities or colleges of United States. SAT is developed and published by the College Board, an organization in United States, administered by the Educational Testing Service.
SAT 2023-24 Linear Functions Graphs Practice Questions
SAT Linear Functions Graphs Question No 1:
The equation of a straight line which cuts off an intercept of 5 units on negative direction of y-axis and makes an angle of 120º with the positive direction of x-axis is
Option A : 3x + y + 5 = 0
Option B : 3x + y – 5 = 0
Option C : 3x – y – 5 = 0
Option D : 3x – y + 5 = 0
Show/Hide Answer Key
Option A : 3x + y + 5 = 0
SAT Linear Functions Graphs Question No 2:
The graph of y = 3x − 1 cuts the y-axis at
Option A : 1
Option B : 3
Option C : 1/3
Option D : -1
Show/Hide Answer Key
Option D : -1
SAT Linear Functions Graphs Question No 3:
ax + by + c = 0 represents a line parallel to x–axis if
Option A : a = 0, b = 0
Option B : a = 0, b ≠ 0
Option C : a ≠ 0, b = 0
Option D : c = 0
Show/Hide Answer Key
Option B : a = 0, b ≠ 0
SAT Linear Functions Graphs Question No 4:
The equation of the straight line that passes through the point (3, 4) and perpendicular to the line 3x + 2y + 5 = 0 is
Option A : 2x + 3y + 6 = 0
Option B : 2x – 3y – 6 = 0
Option C : 2x – 3y + 6 = 0
Option D : 2x + 3y – 6 = 0
Show/Hide Answer Key
Option C : 2x – 3y + 6 = 0
SAT Linear Functions Graphs Question No 5:
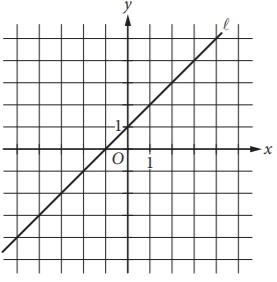
Which of the following is an equation of line A in the xy-plane above?
Option A : x = 1
Option B : y = 1
Option C : y = x
Option D : y = x + 1
Show/Hide Answer Key
Option D : x + 1
SAT Linear Functions Graphs Question No 6:
Which of the following equation represents the above graph of straight line?
Option A : y = x – 2
Option B : y = x + 2
Option C : y = 2x
Option D : y = x/2
Show/Hide Answer Key
Option B : y = x + 2
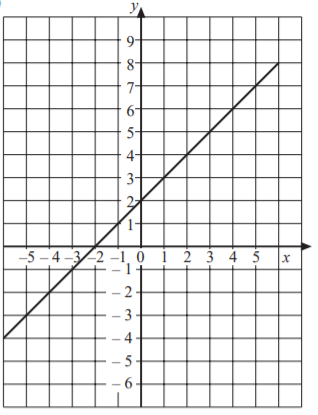
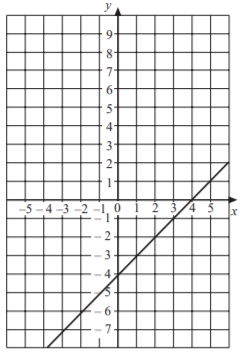
SAT Linear Functions Graphs Question No 7:
Which of the following equation represents the above graph of straight line?
Option A : y = x – 1
Option B : y = x + 1
Option C : y = 2x + 1
Option D : y = 2x – 1
Show/Hide Answer Key
Option D : y = 2x – 1
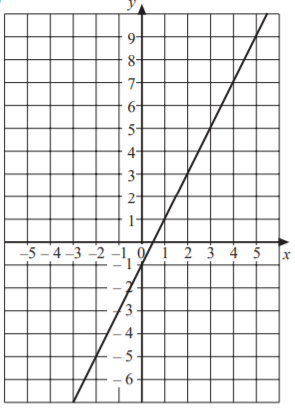
SAT Linear Functions Graphs Question No 8:
Which of the following equation represents the above graph of straight line?
Option A : y = x
Option B : y = 2x
Option C : 2y = x
Option D : y = 3x
Show/Hide Answer Key
Option B : y = 2x
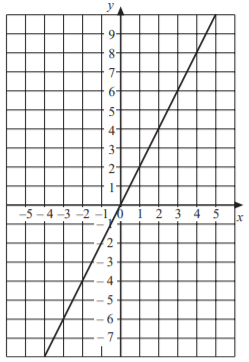
SAT Linear Functions Graphs Question No 9:
Which of the following equation represents the above graph of straight line?
Option A : x – y = 4
Option B : x + y = 4
Option C : x + y = 0
Option D : x – y = 0
Show/Hide Answer Key
Option A : x – y = 4
SAT Linear Functions Graphs Question No 10:
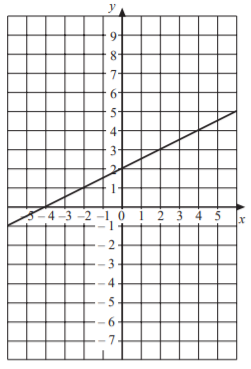
Which of the following equation represents the above graph of straight line?
Option A : x = y/2 + 2
Option B : y = x + 2
Option C : x = y + 2
Option D : y = x/2 + 2
Show/Hide Answer Key
Option D : y = x/2 + 2
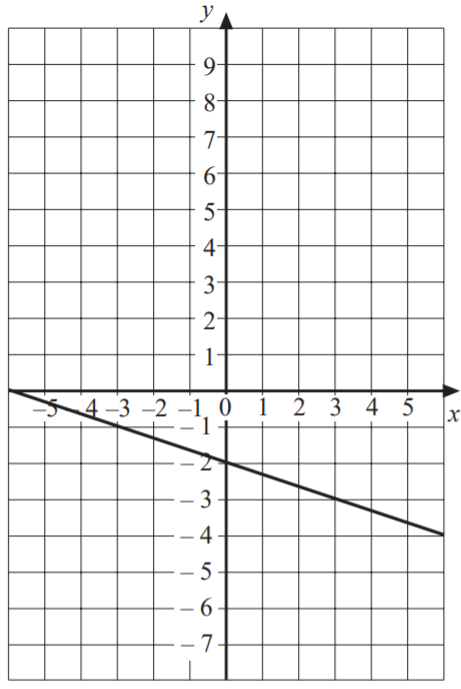
SAT Linear Functions Graphs Question No 11:
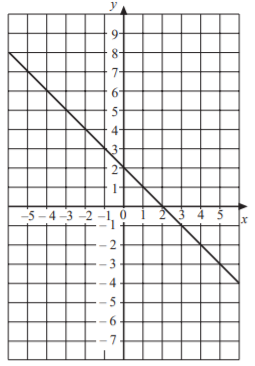
Which of the following equation represents the above graph of straight line?
Option A : x = y
Option B : x – y = 2
Option C : x + y = 2
Option D : x + y = 4
Show/Hide Answer Key
Option C : x + y = 2
SAT Linear Functions Graphs Question No 12:
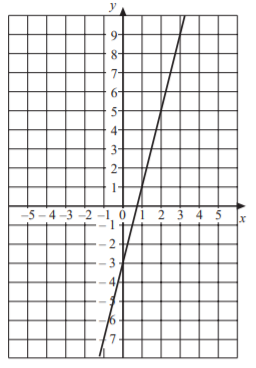
Which of the following equation represents the above graph of straight line?
Option A : y = x + 3
Option B : y = 4x + 3
Option C : y = x – 3
Option D : y = 4x – 3
Show/Hide Answer Key
Option D : y = 4x – 3
SAT Linear Functions Graphs Question No 13:
Which of the following equation represents the above graph of straight line?
Option A : x/5 + y/2 = 1
Option B : x/5 + y/2 = -1
Option C : x/2 + y/5 = 1
Option D : x/2 + y/5 = -1
Show/Hide Answer Key
Option B : x/5 + y/2 = -1
Use the following figure for Questions 14, 15 and 16.
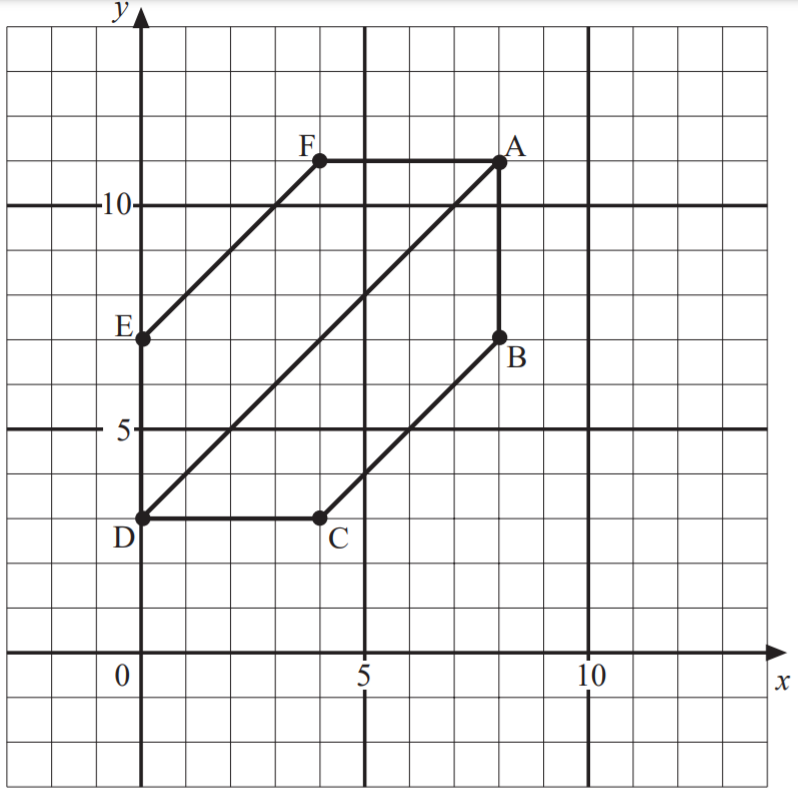
SAT Linear Functions Graphs Question No 14:
A line through A and F has equation y = 11. Write the equation of the line through the points A and B.
Option A : x = 11
Option B : y = 11
Option C : x = 8
Option D : y = 8
Show/Hide Answer Key
Option C : x = 8
SAT Linear Functions Graphs Question No 15:
A line through A and D has equation y = x + 3. Write the equation of the line through the points E and F.
Option A : y = x + 7
Option B : y = x + 1
Option C : x = y + 7
Option D : x = y + 1
Show/Hide Answer Key
Option A : y = x + 7
SAT Linear Functions Graphs Question No 16:
Write the equation of the line through the points B and C.
Option A : y = x + 1
Option B : y = x
Option C : y = x – 1
Option D : y = x – 2
Show/Hide Answer Key
Option C : y = x – 1
SAT Linear Functions Graphs Question No 17:
The equation of the line which passes through the point (0, 2) and has a gradient of 1/3 is
Option A : y = 3x
Option B : y = 3x + 2
Option C : y = x/3
Option D : y = x/3 + 2
Show/Hide Answer Key
Option D : y = x/3 + 2
SAT Linear Functions Graphs Question No 18:
A straight line perpendicular to the line 2x + y = 3 is passing through (1, 1). Its y -intercept is
Option A : 2
Option B : 1/2
Option C : 3
Option D : 1/3
Show/Hide Answer Key
Option B : 1/2
SAT Linear Functions Graphs Question No 19:
The equations y = ±√3x, y =1 are the sides of
Option A : a right triangle
Option B : an equilateral triangle
Option C : an isosceles triangle
Option D : an scalene triangle
Show/Hide Answer Key
Option B : an equilateral triangle
SAT Linear Functions Graphs Question No 20:
A straight line through the point A(3, 4) is such that its intercept between the axes is bisected at A. Its equation is
Option A : 3x – 4y + 7 = 0
Option B : 4x + 3y = 24
Option C : 3x + 4y = 25
Option D : x + y = 7
Show/Hide Answer Key
Option B : 4x + 3y = 24
SAT 2023-24 Quadratic Functions Graphs Practice Questions
SAT Quadratic Functions Graphs Question No 21:
A quadratic function is f(x) = -(x + 2)2 – 7/4. The coordinate of the vertex of the quadratic graph of f(x) is
Option A : (-2, -7/4)
Option B : (2, 7/4)
Option C : (7/4, 2)
Option D : (-7/4, -2)
Show/Hide Answer Key
Option A : (-2, -7/4)
SAT Quadratic Functions Graphs Question No 22:
A quadratic function is given as f(x) = (-1/2)(x – 4)2 + 2. Then, Its
Option A : Maximum value is 4
Option B : Maximum value is 2
Option C : Minimum value is 4
Option D : Minimum value is 2
Show/Hide Answer Key
Option B : Maximum value is 2.
SAT Quadratic Functions Graphs Question No 23:
A quadratic function is given as g(x) = -x2 + 6x – 5. Write the equation in the form g(x) = a(x – h)2 + k.
Option A : g(x) = (x – 3)2 + 4
Option B : g(x) = -(x – 3)2 + 4
Option C : g(x) = (x – 3)2 – 4
Option D : g(x) = -(x – 3)2 – 4
Show/Hide Answer Key
Option B : g(x) = -(x – 3)2 + 4
SAT Quadratic Functions Graphs Question No 24:
A quadratic function is given as g(x) = x2 + 8x + 13. Then, what is the equation of the axis of symmetry of the graph of g(x)?
Option A : x = 4
Option B : x = -4
Option C : y = 8
Option D : y = -8
Show/Hide Answer Key
Option B : x = -4
SAT Quadratic Functions Graphs Question No 25:
A quadratic function is given as g(x) = -2x2 + 12x – 16. Find the y-intercept of the graph of g(x). [y-intercept of the graph is a coordinate where the graph of a function intersects y-axis.]
Option A : (0, 16)
Option B : (-16, 0)
Option C : (16, 0)
Option D : (0, -16)
Show/Hide Answer Key
Option D : (0, -16)
SAT Quadratic Functions Graphs Question No 26:
A quadratic function is given as h(x) = -x2 + 6x – 5. Find the x-intercept(s) of the graph of h(x). [x-intercept(s) of the graph is(are) the coordinate(s) where the graph of a function intersects x-axis.]
Option A : (5, 0) and (1, 0)
Option B : (5, 0) and (-1, 0)
Option C : (-5, 0) and (1, 0)
Option D : (-5, 0) and (-1, 0)
Show/Hide Answer Key
Option A : (5, 0) and (1, 0)
SAT Quadratic Functions Graphs Question No 27:
A quadratic function is given as f(x) = x2 + 8x – 1. Then, Its
Option A : Maximum value is -17
Option B : Maximum value is 17
Option C : Minimum value is -17
Option D : Minimum value is 17
Show/Hide Answer Key
Option C : Minimum value is -17
SAT Quadratic Functions Graphs Question No 28:
A quadratic function is f(x) = x2 + 4x + 6. The coordinate of the vertex of the quadratic graph of f(x) is
Option A : (2, -2)
Option B : (2, 2)
Option C : (-2, 2)
Option D : (-2, -2)
Show/Hide Answer Key
Option C : (-2, 2)
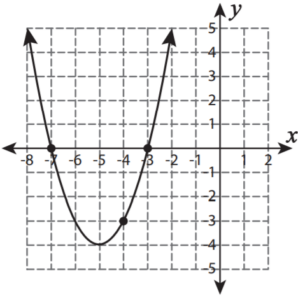
SAT Quadratic Functions Graphs Question No 29:
The equation of the graph given below is
Option A : y = x2
Option B : y = x2 + 4
Option C : y = x2 – 4
Option D : y = x2 – 5
Show/Hide Answer Key
Option C : y = x2 – 4
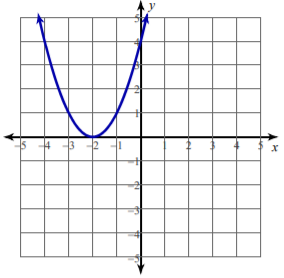
SAT Quadratic Functions Graphs Question No 30:
The equation of the graph given below is
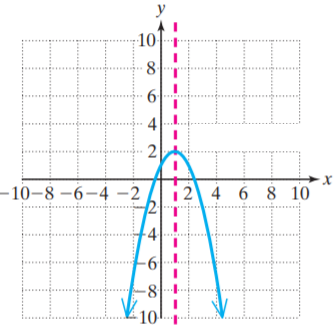
Option A : y = -x2 + 2x + 1
Option B : y = -x2 – 2x – 1
Option C : y = -x2 – 2x + 1
Option D : y = -x2 + 2x – 1
Show/Hide Answer Key
Option A : y = -x2 + 2x + 1
SAT Quadratic Functions Graphs Question No 31:
How many solutions does this quadratic function have?
Option A : No real solutions
Option B : Two real solutions
Option C : Four real solutions
Option D : One real solutions
Show/Hide Answer Key
Option D : Two real solutions
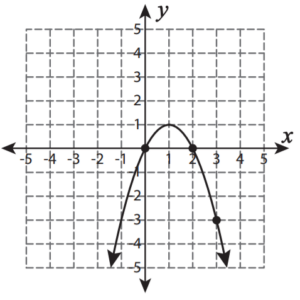
SAT Quadratic Functions Graphs Question No 32:
Identify the roots of the quadratic function whose the graph is given below.
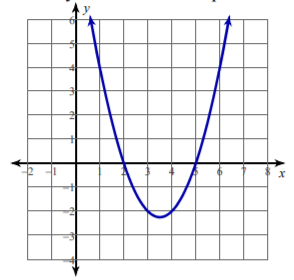
Option A : 2 and 0
Option B : 5 and 6
Option C : 3.5 and 2
Option D : 2 and 5
Show/Hide Answer Key
Option D : 2 and 5
SAT Quadratic Functions Graphs Question No 33:
Which of the following is the graph of f(x) = (x – 1)(x – 5)?
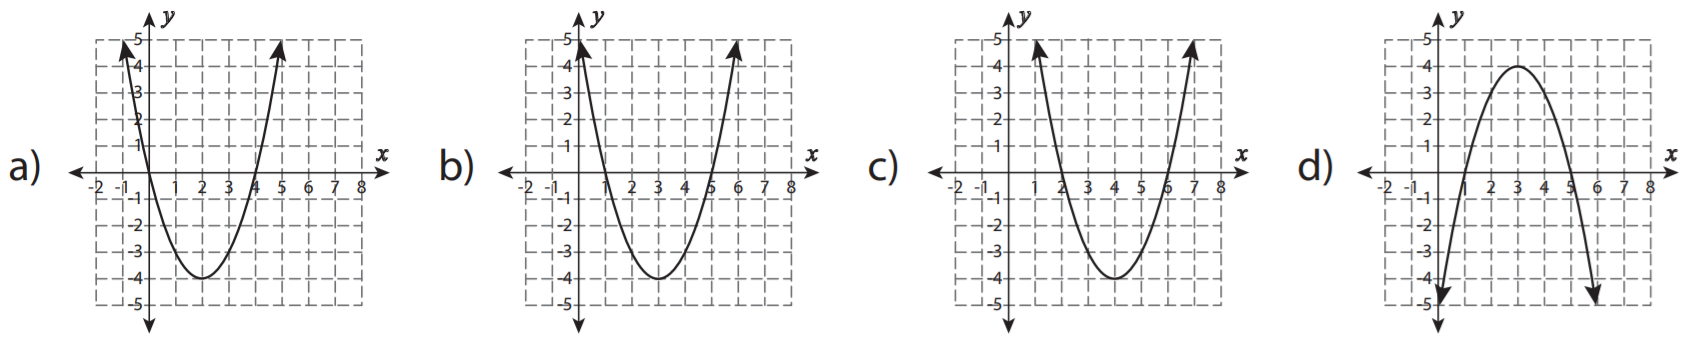
Show/Hide Answer Key
Option B :
SAT Quadratic Functions Graphs Question No 34:
Which of the following is the graph of f(x) = -3(x – 1)2 + 12?
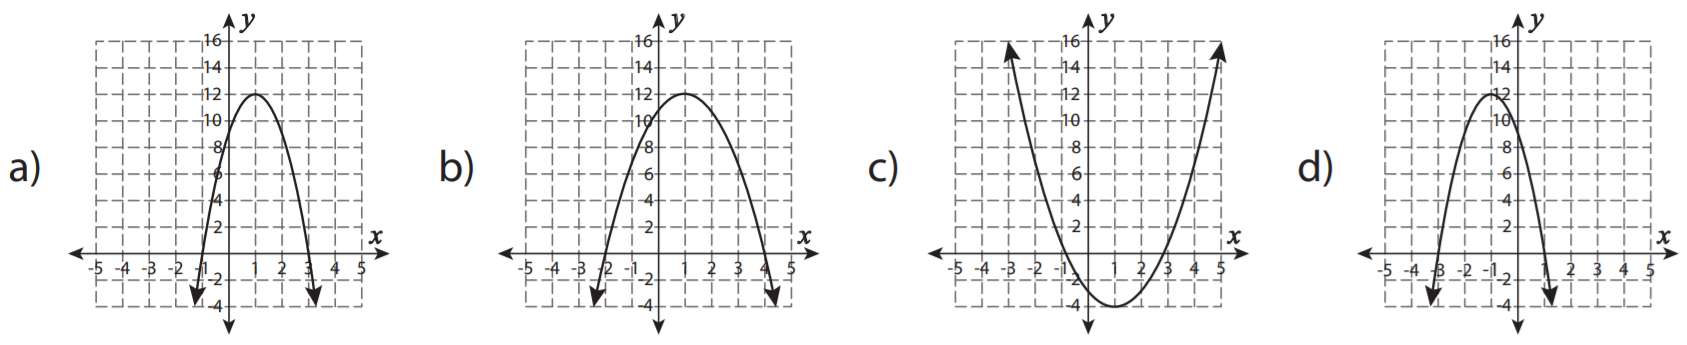
Show/Hide Answer Key
Option A
SAT Quadratic Functions Graphs Question No 35:
Which of the following is the graph of f(x) = -(x – 6)2 + 9?.
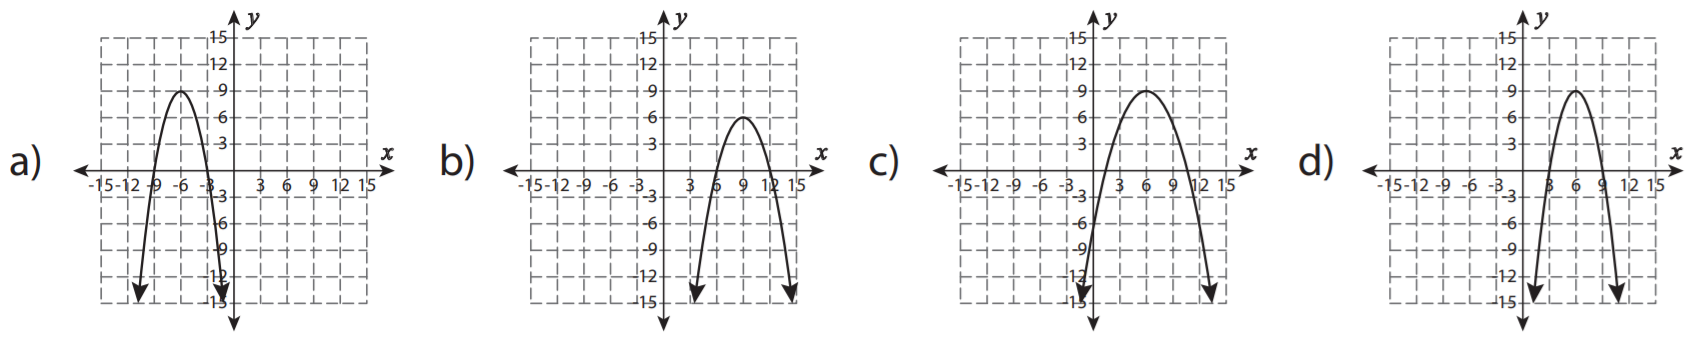
Show/Hide Answer Key
Option D
SAT Quadratic Functions Graphs Question No 36:
Which of the following is the graph of f(x) = (1/4)(x + 2)(x – 4)?
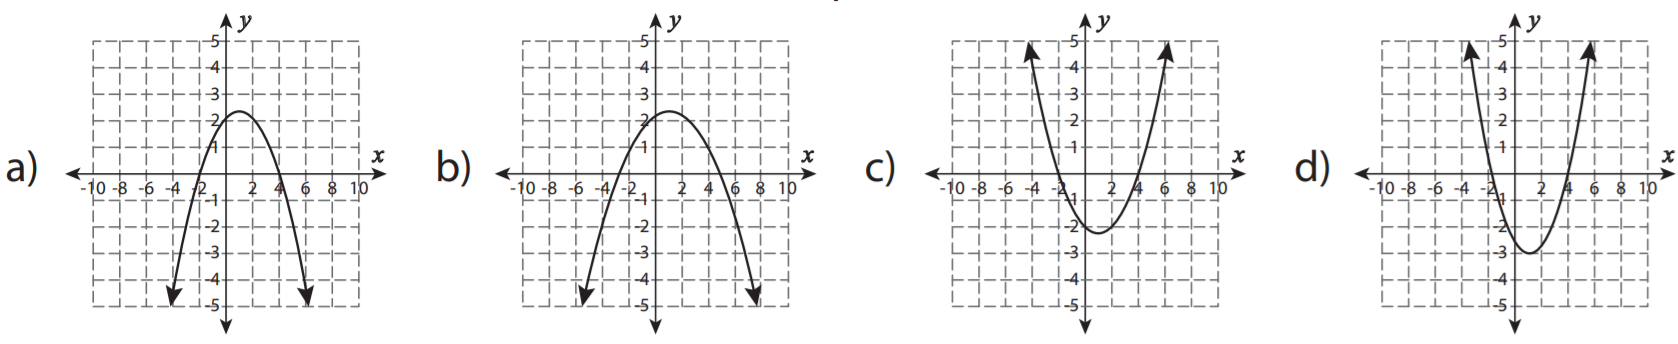
Show/Hide Answer Key
Option C
SAT Quadratic Functions Graphs Question No 37:
Which of the following is the graph of f(x) = (3/2)(x + 3)2 – 6?
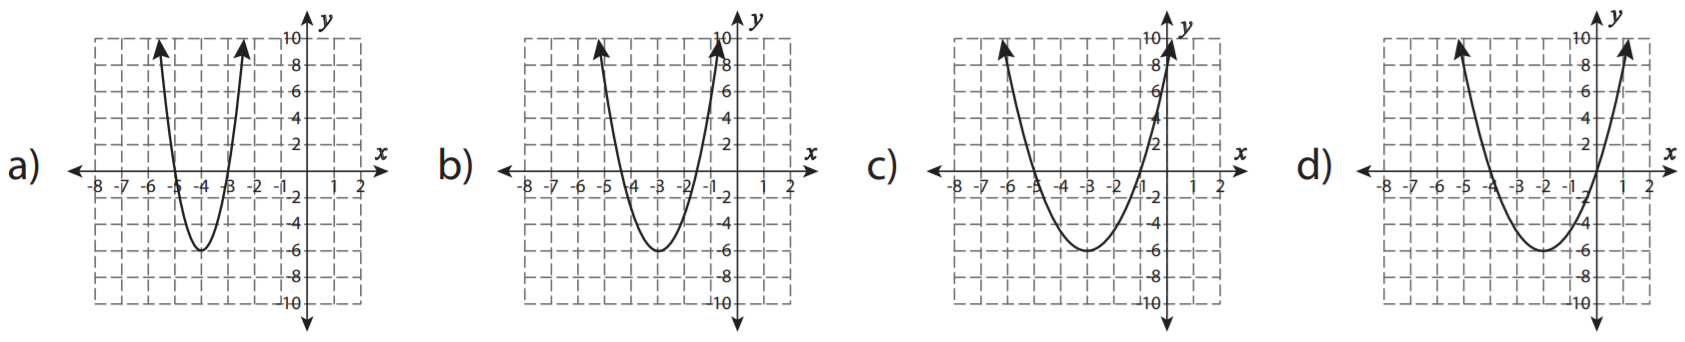
Show/Hide Answer Key
Option C
SAT Quadratic Functions Graphs Question No 38:
Write the quadratic function for the graph given below.
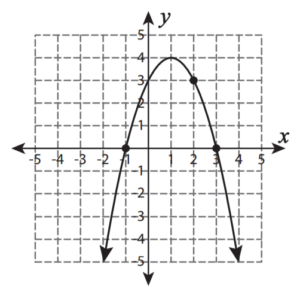
Option A : f(x) = x2 + 2x + 5
Option B : f(x) = x2 – 2x + 3
Option C : f(x) = -x2 + 2x + 3
Option D : f(x) = -x2 + 2x + 5
Show/Hide Answer Key
Option C : f(x) = -x2 + 2x + 3
SAT Quadratic Functions Graphs Question No 39:
Write the quadratic function for the graph given below.
Option A : f(x) = x2 + 10x + 21
Option B : f(x) = x2 + 10x + 15
Option C : f(x) = -x2 + 2x + 15
Option D : f(x) = -x2 + 2x + 21
Show/Hide Answer Key
Option A : f(x) = x2 + 2x + 5
SAT Quadratic Functions Graphs Question No 40:
Write the quadratic function for the graph given below.
Option A : f(x) = -x2 + 2x
Option B : f(x) = x2 + 2x
Option C : f(x) = -x2 + 2x + 1
Option D : f(x) = x2 + 2x + 1
Show/Hide Answer Key
Option A : f(x) = -x2 + 2x
SAT 2023-24 Transformation of Graph Functions Practice Questions
Use the following information for the Question No 41 to 48.
The graph of f(x) = x2 is as below.
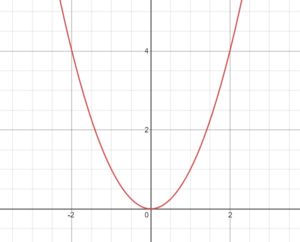
And, use the following options for the Question No 41 to 48.
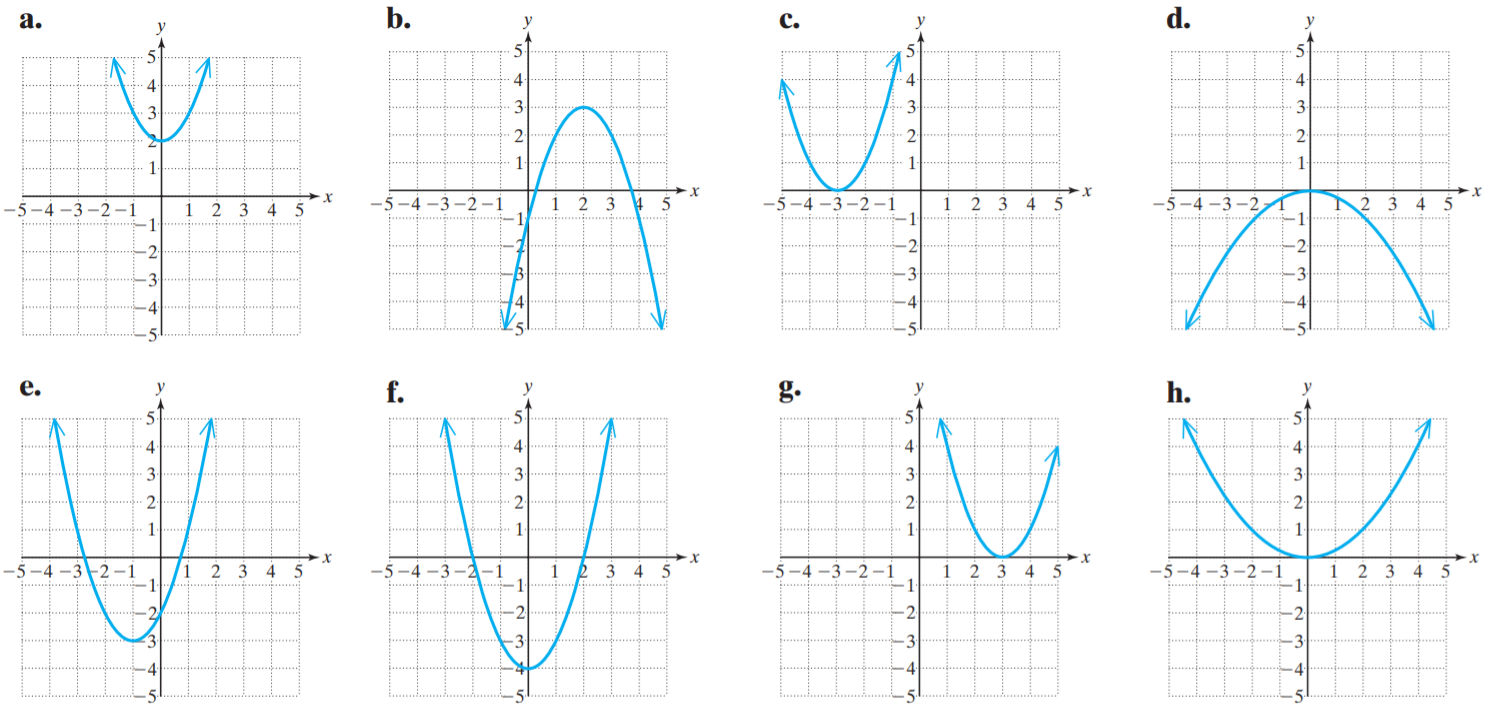
SAT Transformation of Graphs Functions Question No 41:
Which one of the above graphs represents the graph of the function f(x) = (-1/4)x2.
Show/Hide Answer Key
Option D
SAT Transformation of Graphs Functions Question No 42:
Which one of the above graphs represents the graph of the function g(x) = (x + 3)2.
Show/Hide Answer Key
Option C
SAT Transformation of Graphs Functions Question No 43:
Which one of the above graphs represents the graph of the function k(x) = (x – 3)2.
Show/Hide Answer Key
Option G
SAT Transformation of Graphs Functions Question No 44:
Which one of the above graphs represents the graph of the function h(x) = (1/4)x2.
Show/Hide Answer Key
Option H
SAT Transformation of Graphs Functions Question No 45:
Which one of the above graphs represents the graph of the function t(x) = x2 + 2.
Show/Hide Answer Key
Option A
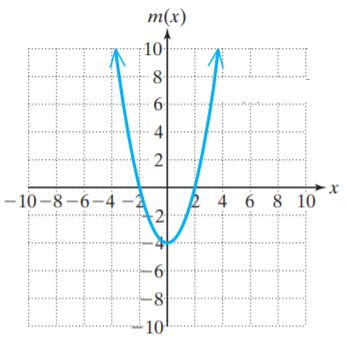
SAT Transformation of Graphs Functions Question No 46:
Which one of the above graphs represents the graph of the function m(x) = x2 – 4.
Show/Hide Answer Key
Option F
SAT Transformation of Graphs Functions Question No 47:
Which one of the above graphs represents the graph of the function p(x) = (x + 1)2 – 3.
Show/Hide Answer Key
Option E
SAT Transformation of Graphs Functions Question No 48:
Which one of the above graphs represents the graph of the function n(x) = -(x – 2)2 + 3.
Show/Hide Answer Key
Option B
SAT Transformation of Graphs Functions Question No 49:
If g(x) is translated function of f(x), then
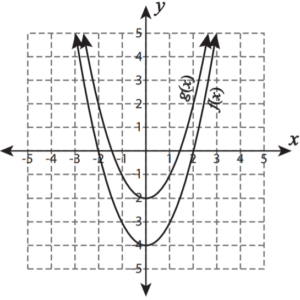
Option A : g(x) shifts 2 units up.
Option B : g(x) shifts 2 units down.
Option C : g(x) shifts 2 units up.
Option D : g(x) shifts 4 units down.
Show/Hide Answer Key
Option A : g(x) shifts 2 units up.
SAT Transformation of Graphs Functions Question No 50:
If g(x) is translated function of f(x), then
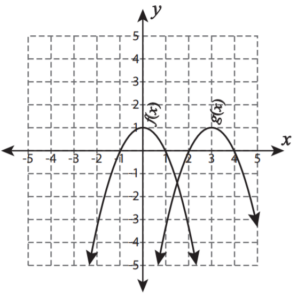
Option A : g(x) shifts 3 units left.
Option B : g(x) shifts 3 units right.
Option C : g(x) shifts 4 units left.
Option D : g(x) shifts 2 units right.
Show/Hide Answer Key
Option B : g(x) shifts 3 units right.
SAT Transformation of Graphs Functions Question No 51:
If g(x) is translated function of f(x), then
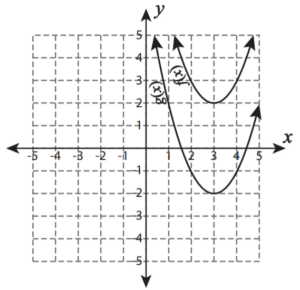
Option A : g(x) shifts 2 units up.
Option B : g(x) shifts 3 units down.
Option C : g(x) shifts 1 units up.
Option D : g(x) shifts 4 units down.
Show/Hide Answer Key
Option D : g(x) shifts 4 units down.


