Welcome to AMBiPi (Amans Maths Blogs). In this article, you will get 51 SAT Data Analysis Practice Questions with Answer Keys | SAT 2023-24 Online Courses AMBiPi. SAT (Scholastic Assessment Test) is a standard test, used for taking admission to undergraduate programs of universities or colleges of United States. SAT is developed and published by the College Board, an organization in United States, administered by the Educational Testing Service.
SAT 2023-24 Data Analysis Practice Questions
SAT Data Analysis Question No 1:
If A and B together can complete a work in 15 days and B alone in 20 days, in how many days can A alone complete the work?
Option A : 60
Option B : 45
Option C : 40
Option D : 30
Show/Hide Answer Key
Option A : 60
SAT Data Analysis Question No 2:
If A and B can do a work in 12 days, B and C in 15 days and C and A in 20 days. If A, B and C work together, they will complete the work in :
Option A : 5 days
Option B : 7 5/6 days
Option C : 10 days
Option D : 15 2/3 days
Show/Hide Answer Key
Option C : 10 days
SAT Data Analysis Question No 3:
A and B can do a piece of work in 72 days. B and C can do it in 120 days, A and C can do it in 90 days. In how many days all the three together can do the work ?
Option A : 80 days
Option B : 100 days
Option C : 60 days
Option D : 150 days
Show/Hide Answer Key
Option C : 60 days
SAT Data Analysis Question No 4:
A particular job can be completed by a team of 10 men in 12 days. The same job can be completed by a team of 10 women in 6 days. How many days are needed to complete the job if the two teams work together?
Option A : 4 days
Option B : 6 days
Option C : 9 days
Option D : 18 days
Show/Hide Answer Key
Option A : 4 days
SAT Data Analysis Question No 5:
A can do a work in 6 days and B in 9 days. How many days will both take together to complete the work?
Option A : 7.5 days
Option B : 5.4 days
Option C : 3.6 days
Option D : 3 days
Show/Hide Answer Key
Option C : 3.6 days
SAT Data Analysis Question No 6:
A and B can do a piece of work in 10 days, B and C in 15 days and C and A in 20 days. C alone can do the work in :
Option A : 60 days
Option B : 120 days
Option C : 80 days
Option D : 30 days
Show/Hide Answer Key
Option B : 120 days
SAT Data Analysis Question No 7:
In 4 litres of milk and water mixture, the concentration of milk is 80%. A woman takes out 20% of the total mixture and add the same quantity of water. With the total quantity of new mixture, she wants to prepare coffee where the concentration of water should be 60%. How many litres of more water will she require to prepare coffee?
Option A : 2.6 liters
Option B : 2.4 liters
Option C : 2 liters
Option D : 2.5 liters
Show/Hide Answer Key
Option B : 2.4 liters
SAT Data Analysis Question No 8:
A farmer mixes two varieties of rice of price Rs. 36 per kg and Rs. 24 per kg in the ratio of 1: 2, respectively. He sold the mixture for Rs. 2100 to earn a profit of 25%, then find the quantity of rice of cost Rs. 24 per kg used in the mixture
Option A : 20 kg
Option B : 30 kg
Option C : 40 kg
Option D : 50 kg
Show/Hide Answer Key
Option C : 40 kg
SAT Data Analysis Question No 9:
A vessel contains 208 litres mixture of milk and water mixed in the ratio 11 : 5 respectively. ‘8x’ litres of mixture is taken out of the vessel and replaced with ‘3x – 4’ litres of water so that the ratio of milk to water in the vessel becomes 4 : 3 respectively. Find the difference between the final quantities of milk and water in the vessel.
Option A : 21 litres
Option B : 22 litres
Option C : 23 litres
Option D : 24 litres
Show/Hide Answer Key
Option B : 22 litres
SAT Data Analysis Question No 10:
A container contains a mixture of liquid A and liquid B in the ratio 12 : 13 respectively. Some amount of mixture have been withdrawn and some amount of liquid C is added and then the ratio of liquid A, liquid B and liquid C become 24 : 26 : 29 respectively. After adding liquid C, the total amount of mixture in the container is 10 litres less than the initial amount of mixture. If the amount of liquid A taken out from container is 146 litres less than the amount of liquid C added to the container, then find the amount of liquid B initially in the container.
Option A : 416 litres
Option B : 650 litres
Option C : 468 litres
Option D : 325 litres
Show/Hide Answer Key
Option A : 416 litres
SAT Data Analysis Question No 11:
Two vessels A and B of equal volume contain milk and water in the ratio 3 : 2 and 2 : 1 to their brim respectively. Two litres of the solution from vessel A and three litres of the solution from vessel B are poured into a big empty vessel C. If the solution in C occupied 40% of the capacity of C, what proportion of the volume of vessel C should be the volume of water that shall be added so that the ratio of milk and water in vessel C becomes 1 : 1?
Option A : 21/125
Option B : 2/25
Option C : 4/75
Option D : 14/125
Show/Hide Answer Key
Option D : 14/125
SAT Data Analysis Question No 12:
There are two containers A and B containing mixture of milk and water. The concentration of milk in container A and B is (x – 5) % and (x + 10)% respectively. If both mixtures are mixed together in a certain ratio to get 85 litres of mixture in which the concentration of milk is (x + 4)%, find the amount of mixture used from container B.
Option A : 17 litres
Option B : 34 litres
Option C : 51 litres
Option D : 68 litres
Show/Hide Answer Key
Option C : 51 litres
SAT Data Analysis Question No 13:
John and Mary have some marbles. The total number of marbles with John and Mary is 75 times the ratio of the number of marbles with John to that with Mary. If Mary has 30 marbles, find the number of marbles with John.
Option A : 20
Option B : 30
Option C : 45
Option D : 50
Show/Hide Answer Key
Option A : 20
SAT Data Analysis Question No 14:
John has twice the amount of money as Peter has. If John gives $50 to Peter, the ratio of the amount of money with them is reserved. Find the total amount of money with both of them.
Option A : 50
Option B : 100
Option C : 150
Option D : 200
Show/Hide Answer Key
Option C : 150
SAT Data Analysis Question No 15:
Jack, Tom, Beth and Ruth each have a number of marbles. Jack has 10 marbles, the least, while Tom has 27 marbles, the highest. Which of the following could be the average of the number of marbles present with all of them, given that no two of them has the same number of marbles?
Option A : 13
Option B : 17
Option C : 23
Option D : 26
Show/Hide Answer Key
Option B : 17
SAT Data Analysis Question No 16:
7 pounds of plums make 8 rolls of fruit leather. If every batch of fruit leather requires the same amount of plums, how many pounds of plums are required to make 20 rolls of fruit leather?
Option A : 0.875 pounds
Option B : 2.5 pounds
Option C : 17.5 pounds
Option D : 23 pounds
Show/Hide Answer Key
Option C : 17.5 pounds
SAT Data Analysis Question No 17:
In an entrance examination, 3/5th of all candidates were male. 1/3rd of all candidates failed to clear the entrance examination. 1/4th of all male candidates failed to clear the examination. Among the candidates who cleared the examination, what fraction is female?
Option A : 32.5%
Option B : 54.2%
Option C : 67.5%
Option D : 75.0%
Show/Hide Answer Key
Option A : 32.5%
SAT Data Analysis Question No 18:
If SP = $900 and loss = 25%, then CP is
Option A : $1200
Option B : $1033
Option C : $1150
Option D : $1250
Show/Hide Answer Key
Option A : $1200
SAT Data Analysis Question No 19:
If CP = $900, proft = $120 and the discount offered is $80, then MP (marked price) is
Option A : $1020
Option B : $980
Option C : $940
Option D : $1100
Show/Hide Answer Key
Option D : $1100
SAT Data Analysis Question No 20:
A profit of 10% can be made by selling an article for $759. The cost price of the article is
Option A : $840
Option B : $770.5
Option C : $690
Option D : $675
Show/Hide Answer Key
Option C : $690
SAT Data Analysis Question No 21:
If a retailer bought some books for $7500 and spent $500 on transportation charges, then find the over all loss incurred by him, if he sold them for $7950.
Option A : $40
Option B : $50
Option C : $500
Option D : No Loss
Show/Hide Answer Key
Option B : $50
SAT Data Analysis Question No 22:
If a book bought for $500 is sold to make to make a profit of 25%, then the selling price is
Option A : $600
Option B : $625
Option C : $700
Option D : $650
Show/Hide Answer Key
Option B : $625
SAT Data Analysis Question No 23:
A shopkeeper bought a book for $300. Due to the damage, caused during transportation, he sold it for $270. Find the loss percentage.
Option A : 10%
Option B : 15%
Option C : 30%
Option D : 20%
Show/Hide Answer Key
Option A : 10%
SAT Data Analysis Question No 24:
A retailer buys a TV for $425. His overhead expenses are $55. If he sell the TV for $560, then the profit percentage is
Option A : 12.5%
Option B : 16.67%
Option C : 18.5%
Option D : 13.33%
Show/Hide Answer Key
Option B : 16.67%
SAT Data Analysis Question No 25:
A man sells 200 mangoes at the cost price of 250 mangoes. His profit percentage is
Option A : 12.5%
Option B : 25%
Option C : 20%
Option D : 25.5%
Show/Hide Answer Key
Option B : 25%
SAT Data Analysis Question No 26:
The simple interest on a sum of money is 4/9 times the principal and the rate of interest per annum is numerically equal to the number of years. Find the rate of interest per annum.
Option A : 10/3%
Option B : 15/3%
Option C : 20/3%
Option D : 15/2%
Show/Hide Answer Key
Option C : 20/3%
SAT Data Analysis Question No 27:
A certain sum becomes 3 times itself in 6 years at simple interest. In how many years will it become 9 times itself?
Option A : 18
Option B : 20
Option C : 24
Option D : 22
Show/Hide Answer Key
Option C : 24
SAT Data Analysis Question No 28:
A certain sum amounts to four time the principal within a period of 2 years. The rate of simple interest per annum is
Option A : 50%
Option B : 15%
Option C : 1.5%
Option D : 10%
Show/Hide Answer Key
Option A : 50%
SAT Data Anaylsis Question No 29:
A certain sum becomes $6400 in 4 years and $8200 in 7 years at simple interest. Find the principal.
Option A : $4000
Option B : $4200
Option C : $4400
Option D : $4500
Show/Hide Answer Key
Option A : $4000
SAT Data Analysis Question No 30:
A sum of money amounts to $2000 in 3 years and $2500 in 5 year at simple interest. Find the rate of interest per annum.
Option A : 33 1/3%
Option B : 12 1/3%
Option C : 25%
Option D : 20%
Show/Hide Answer Key
Option D : 20%
SAT Data Analysis Question No 31:
In a class, there are 225 students. Which of the following cannot be the ratio of the number of students passed to the number of students failed?
Option A : 2 : 3
Option B : 7 : 8
Option C : 5 : 4
Option D : 3 : 4
Show/Hide Answer Key
Option D : 3 : 4
SAT Data Analysis Question No 32:
A sum of $4680 was divided among Alex, Tom and John in the ratio of 1/2 : 1/3 : 1/4. Find the share of Alex (in $).
Option A : 1440
Option B : 1080
Option C : 2160
Option D : 720
Show/Hide Answer Key
Option C : 2160
SAT Data Analysis Question No 33:
Present age of A and B are in the ratio 7 : 4. Which of the following can be difference between their ages after 8 years?
Option A : 5 years
Option B : 10 years
Option C : 15 years
Option D : 20 years
Show/Hide Answer Key
Option C : 15 years
SAT Data Analysis Question No 34:
If the ratio of ages (in years) of A and B, 5 years ago was 5 : 7, then which of the following can be the sum of their ages 5 years from now?
Option A : 90
Option B : 98
Option C : 92
Option D : 87
Show/Hide Answer Key
Option C : 92
SAT Data Analysis Question No 35:
Incomes of A and B are $3500 and $4200, respectively. The ratio of their saving of A and B is 4 : 3 and the ratio of their experiments is 3 : 4. Find the saving of A.
Option A : $800
Option B : $600
Option C : $900
Option D : $1000
Show/Hide Answer Key
Option A : $800
SAT Data Analysis Question No 36:
If the ratio of the ages (in years) of x and y, 8 years ago is 7 : 6, then which of the following can be the sum of their ages 8 years from now?
Option A : 82
Option B : 97
Option C : 75
Option D : 94
Show/Hide Answer Key
Option B : 97
SAT Data Analysis Question No 37:
If P : Q : R = 2 : 3 : 4 are in the proportion, then the value of x is
Option A : 15
Option B : 16
Option C : 18
Option D : 20
Show/Hide Answer Key
Option D : 20
SAT Data Analysis Question No 38:
If x : y = 3 : 7, then find (7x + 3y) : (9x – 3y).
Option A : 7 : 1
Option B : 1 : 7
Option C : 7 : 3
Option D : 3 : 7
Show/Hide Answer Key
Option A : 7 : 1
SAT Data Analysis Question No 39:
The range of x, 14, 17, 23, 26 and 46 is 33. Which of the following can be the value of x?
Option A : 32
Option B : 47
Option C : 48
Option D : 26
Show/Hide Answer Key
Option B : 47
SAT Data Analysis Question No 40:
If the mean of 2, x and y is 8, then the mean of x, y and 8 is
Option A : 8
Option B : 9
Option C : 12
Option D : 10
Show/Hide Answer Key
Option D : 10
SAT Data Analysis Question No 41:
The median of x, y, z, p, q and r (x . y > z > p > q > r) is m, then find the median of 2q, 2p, 2z and 2y.
Option A : m/2
Option B : m
Option C : 2m
Option D : 2
Show/Hide Answer Key
Option C : 2m
SAT Data Analysis Question No 42:
A bar graph is drawn to the scale of 1 cm = k units. The length of the bar representing a quantity 405 units is 5.4 cm. Find k.
Option A : 100
Option B : 70
Option C : 80
Option D : 75
Show/Hide Answer Key
Option D : 75
SAT Data Analysis Question No 43:
The range of 9, 13, 18, 21, 33, 46 and x is 39. Which of the following can be the value of x?
Option A : 47
Option B : 50
Option C : 7
Option D : 8
Show/Hide Answer Key
Option C : 7
SAT Data Analysis Question No 44:
If the mean of a, b and c is same as the mean of b, c and d. Then, which of the following is correct?
Option A : a = b = c
Option B : b = c = d
Option C : b = c
Option D : a = d
Show/Hide Answer Key
Option D : a = d
SAT Data Analysis Question No 45:
If the ratio of mode and median is 9 : 7, then find the ratio of mean and mode.
Option A : 2 : 3
Option B : 4 : 5
Option C : 5 : 9
Option D : 8 : 9
Show/Hide Answer Key
Option A : 2 : 3
SAT Data Analysis Question No 46:
John runs at different speeds as part of his training program. The graph shows his target heart rate at different times during his workout. On which interval is the target heart rate strictly increasing then strictly decreasing?
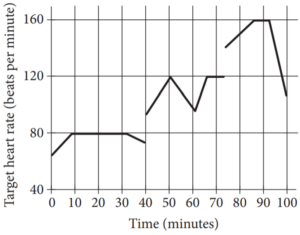
Option A : Between 0 and 30 minutes
Option B : Between 40 and 60 minutes
Option C : Between 50 and 65 minutes
Option D : Between 70 and 90 minutes
Show/Hide Answer Key
Option D : Between 70 and 90 minutes
SAT Data Analysis Question No 47:
The number of rooftops with solar panel installations in 5 cities is shown in the graph above. If the total number of installations is 27,500, what is an appropriate label for the vertical axis of the graph?
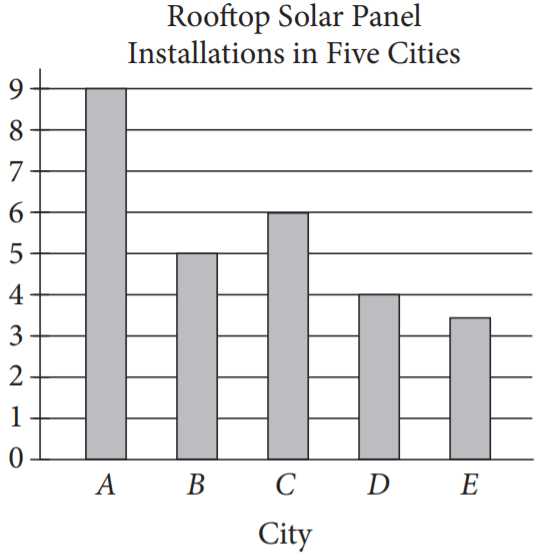
Option A : Number of installations (in tens)
Option B : Number of installations (in hundreds)
Option C : Number of installations (in thousands)
Option D : Number of installations (in tens of thousands)
Show/Hide Answer Key
Option B : Number of installations (in hundreds)
SAT Data Analysis Question No 48:
Based on the histogram above, of the following, which is closest to the average (arithmetic mean) number of seeds per apple?
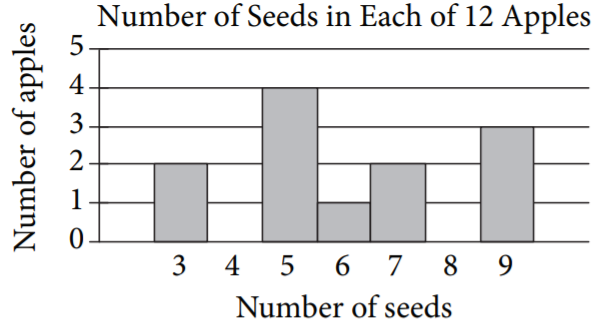
Option A : 4
Option B : 5
Option C : 6
Option D : 7
Show/Hide Answer Key
Option D : 7
SAT Data Analysis Question No 49:
The table above lists the lengths, to the nearest inch, of a random sample of 21 brown bullhead fish. The outlier measurement of 24 inches is an error. Of the mean, median, and range of the values listed, which will change the most if the 24-inch measurement is removed from the data?
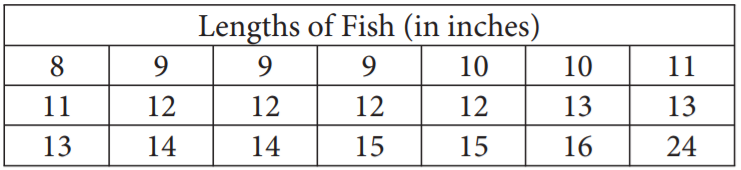
Option A : Mean
Option B : Median
Option C : Mode
Option D : Range
Show/Hide Answer Key
Option A : Mean
SAT Data Analysis Question No 50:
According to the line of best fit in the scatterplot above, which of the following best approximates the year in which the number of miles traveled by air passengers in Country X was estimated to be 550 billion?
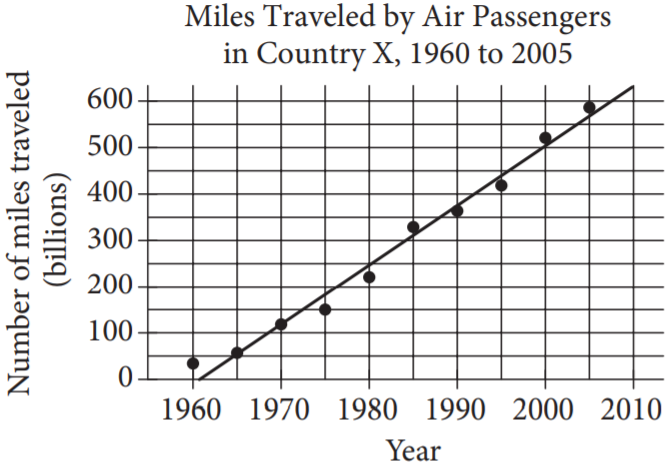
Option A : 1997
Option B : 2000
Option C : 2003
Option D : 2008
Show/Hide Answer Key
Option A : 2003
SAT Data Analysis Question No 51:
The graph above shows Marilyn’s distance from her campsite during a 3‑hour hike. She stopped for 30 minutes during her hike to have lunch. Based on the graph, which of the following is closest to the time she finished lunch and continued her hike?
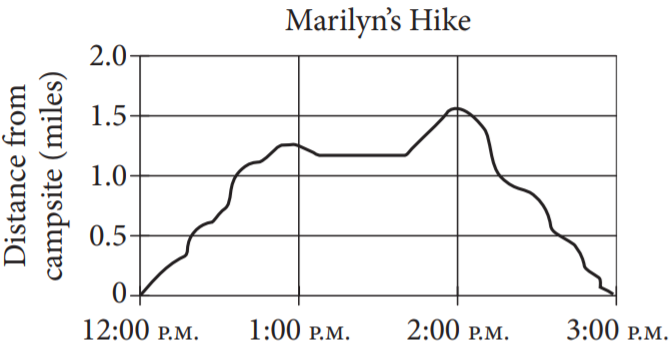
Option A : 12:40 PM
Option B : 1:10 PM
Option C : 1:40 PM
Option D : 2:00 PM
Show/Hide Answer Key
Option C : 1:40 PM


