Welcome to AMBiPi (Amans Maths Blogs). In this article, you will get SAT Math Practice Online | Graphing Linear Equations | SAT Online Tutor AMBiPi.
SAT Math Multiple Choice Practice Questions
Graphing Linear Equations Multiple Choice Questions with Answer Keys
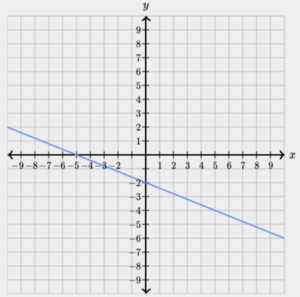
SAT Math Practice Question No 1:
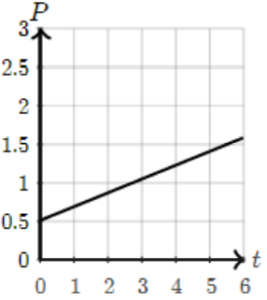
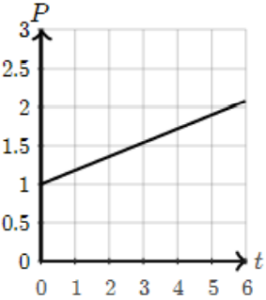
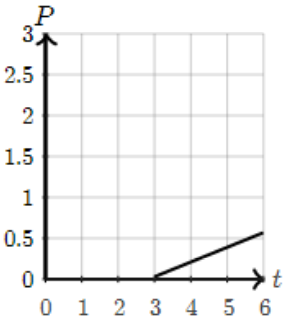
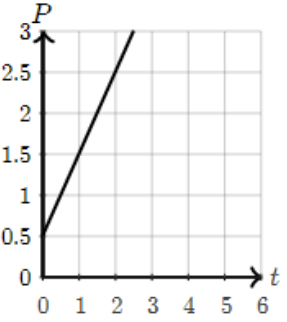
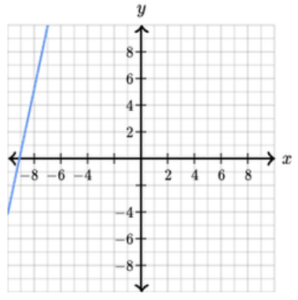
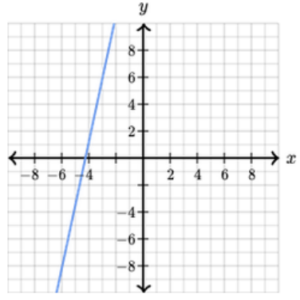
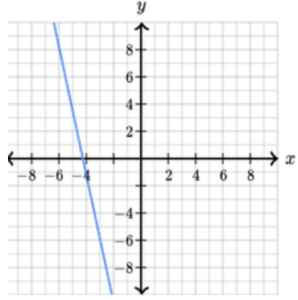
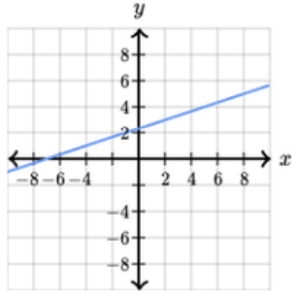
The average price of a certain type of coffee worldwide was $0.51 per pound in 2008. The price per pound increased about $0.18 each year until 2014, and is expected to do so for the next two years. Which of the following graphs represents the relationship between years after 2008, t, and price per pound, P, in dollars, of this coffee worldwide?
Option A :
Option B :
Option C :
Option D :
Show/Hide Answer Key
Option A :
SAT Math Practice Question No 2:
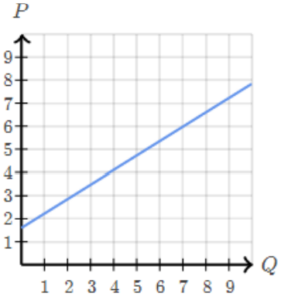
A farmer observes that the demand for corn Q, in thousands of bushels per month, and price P, in dollars per bushel, are related by a linear function. If a demand of 2,500 bushels per month corresponds to a price of $4.00 per bushel, and a demand of 3,000 bushels per month corresponds to a price of $3.20 per bushel, which of the following graphs represents the relationship between P and Q?
Option A :
Option B :
Option C :
Option D :
Show/Hide Answer Key
Option D :
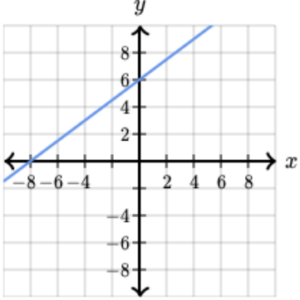
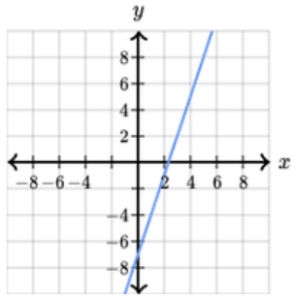
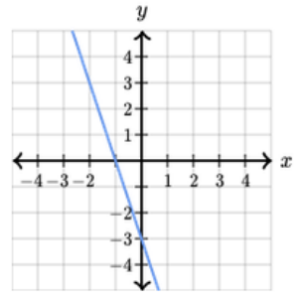
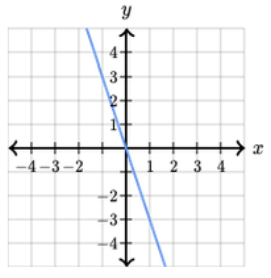
SAT Math Practice Question No 3:
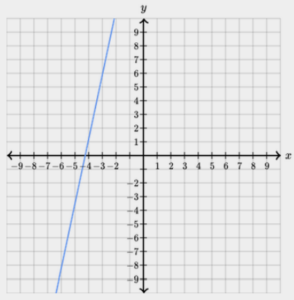
The lines f and g are graphed BELOW in the xy-plane. Line g can be written as the equation y=ax+b, where a and b are constants. Which of the following equations represents line f? Please choose from one of the following options?
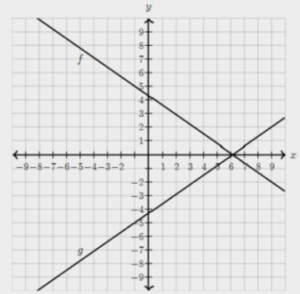
Option A : y = ax – b
Option B : y = -ax + b
Option C : -y = ax + b
Option D : x = ay + b
Show/Hide Answer Key
Option C : -y = ax + b
SAT Math Practice Question No 4:
Which of the following graphs represents the equation (y + 6) = (-3/2)(x – 8)?
Option A :
Option B :
Option C :
Option D :
Show/Hide Answer Key
Option A :
SAT Math Practice Question No 5:
The equation y = (3/2)(x − 8) is graphed in the xy-plane. Which of the following equations will have a graph that is parallel to the graph of the above equation and have an x-intercept on the negative x-axis?
Option A : y = (3/2)(x + 8)
Option B : y = 3x/2 – 8
Option C : y = (-2/3)(x + 8)
Option D : y = -2x/3 – 8
Show/Hide Answer Key
Option A : y = (3/2)(x + 8)
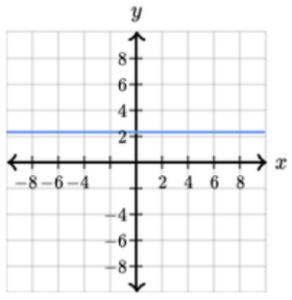
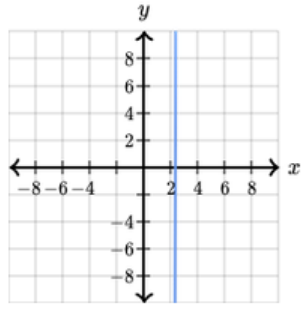
SAT Math Practice Question No 6:
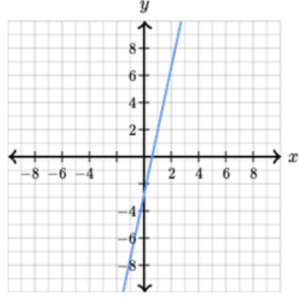
Which of the following equations represents the line graphed BELOW in the xy-plane?
Option A : x = -4
Option B : y = -4
Option C : y = x – 4
Option D : x = y – 4
Show/Hide Answer Key
Option B : y = -4
SAT Math Practice Question No 7:
Which of the following equations represents a line in the xy-plane with an x-intercept at (−15,0) and a y-intercept at (0,−9)?
Option A : x/15 + y/9 = 1
Option B : –x/15 – y/9 = 1
Option C : x/9 – y/15 = 1
Option D : –x/9 + y/15 = 1
Show/Hide Answer Key
Option B : -x/15 – y/9 = 1
SAT Math Practice Question No 8:
Two lines graphed in the xy-plane have the equations 2x+5y=20 and y=kx-3, where k is a constant. For what value of k will the two lines be perpendicular?
Option A : -2/5
Option B : 2/5
Option C : 5/2
Option D : -5/2
Show/Hide Answer Key
Option C : 5/2
SAT Math Practice Question No 9:
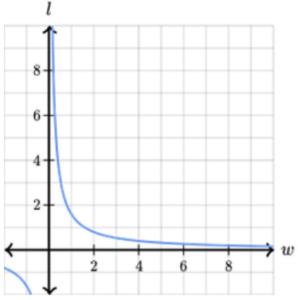
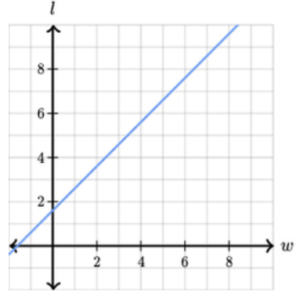
A rectangle is said to have a golden ratio if the ratio of its length to width is equal to approximately 1.6. Which of the following graphs represents the relationship between length, l, and width, w, in a golden rectangle?
Option A :
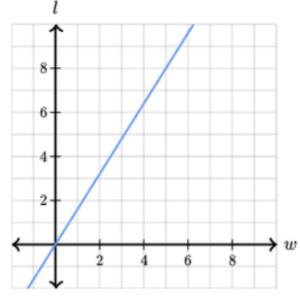
Option B :
Option C :
Option D :
Show/Hide Answer Key
Option A :
SAT Math Practice Question No 10:
The line graphed BELOW in the xy-plane can be written as the equation y – c = m(x – d), where c, d, and m are constants. Which of the following represents the graph of y – c + 4 = m(x – d – 4)?
Option A :
Option B :
Option C :
Option D :
Show/Hide Answer Key
Option A:
SAT Math Practice Question No 11:
Which of the following represents the graph of the equation 3y – 7 = 0?
Option A :
Option B :
Option C :
Option D :
Show/Hide Answer Key
Option C :
SAT Math Practice Question No 12:
The equations x + y = 3 and -5x – 5y = -15 are graphed in the xy-plane. Which of the following must be true of the graphs of the two equations?
Option A : The slope of the graph of x+y=3is 11 and the slope of the graph of -5x-5y=-15 is −1.
Option B : The graphs of the two equations are perpendicular lines.
Option C : The y-intercept of the graph of – 5x – 5y = -15 is -15−15.
Option D : The graphs of the two equations are the same line.
Show/Hide Answer Key
Option D : The graphs of the two equations are the same line.
SAT Math Practice Question No 13:
Which of the following represents the graph of the equation x = -y/3?
Option A :
Option B :
Option C :
Option D :
Show/Hide Answer Key
Option D :
SAT Math Practice Question No 14:
The line represented by the equation y = 1/12 – x is graphed in the xy-plane. Which of the following statements correctly describes the graph of the line?
Option A : The line is perpendicular to the graph x + y = 1.
Option B : The line has a negative slope and a positive y-intercept.
Option C : The line has a positive slope and a negative y-intercept.
Option D : The x-intercept is equal to the negative of the y-intercept.
Show/Hide Answer Key
Option B : The line has a negative slope and a positive y-intercept.
SAT Math Practice Question No 15:
What is the equation of the line graphed in the xy-plane that passes through the point (-4, -5) and is parallel to the line whose equation is 3x – 4y = -8?
Option A : y = -4x/3 + 10
Option B : y = 3x/4 – 2
Option C : y = 3x/4 – 8
Option D : y = -4x/3 – 8
Show/Hide Answer Key
Option B : y = 3x/4 – 2
SAT 2024 Math Grid-in Practice Questions
Graphing Linear Equations Grid-in Choice Questions with Answer Keys
SAT Math Practice Question No 16:
The equation 6y+12x=18 is graphed in the xy-plane. What is the slope of the line whose graph is perpendicular to the graph of the above equation?
Show/Hide Answer Key
Correct Answer : 1/2
SAT Math Practice Question No 17:
Which of the following equations represents a line in the xy-plane with an x-intercept at (-2, 0) and a slope of 4?
Show/Hide Answer Key
Correct Answer : y = 4x + 8
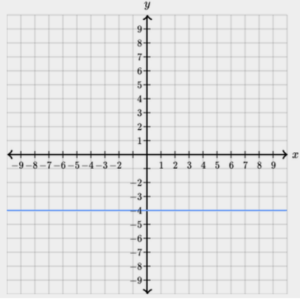
SAT Math Practice Question No 18:
A graphed in the xy-plane that passes through the point (−1, 3.5) and is perpendicular to the line B whose equation is x + 4.5 = 0?
Show/Hide Answer Key
Correct Answer : y = 3.5
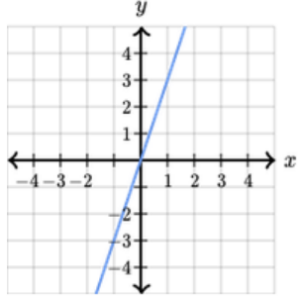
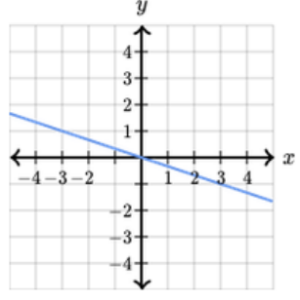
SAT Math Question No 19:
A line is graphed as shown BELOW. What is the equation which represents the line?
Show/Hide Answer Key
Correct Answer : y = -2x/5 – 2
SAT Math Practice Test Question No 20:
What is the equation that represents a line in the xy-plane with an x-intercept at (−2,0) and a slope of 4?
Show/Hide Answer Key
Correct Answer : y = 4x + 8


